


Step Four
Interpreting the Results

The Model updates every time you press the ‘Run Scenario’ Button
With each run - any variable that is changed in value is coloured Yellow so it is easily identified
Each variable block shows:
- The name of variable
- Column 1: The years being used
- Column 2: The base case - that is, the actual value for the start year and base case forecast value for the selected future year, the extent to which the variable changes in absolute value between those two years and the Compound Average Growth rate (CAGR) for that period
- Column 3: The base case and then the revised value for the future year (in yellow if different from the base case), the absolute change from the start year and CAGR.
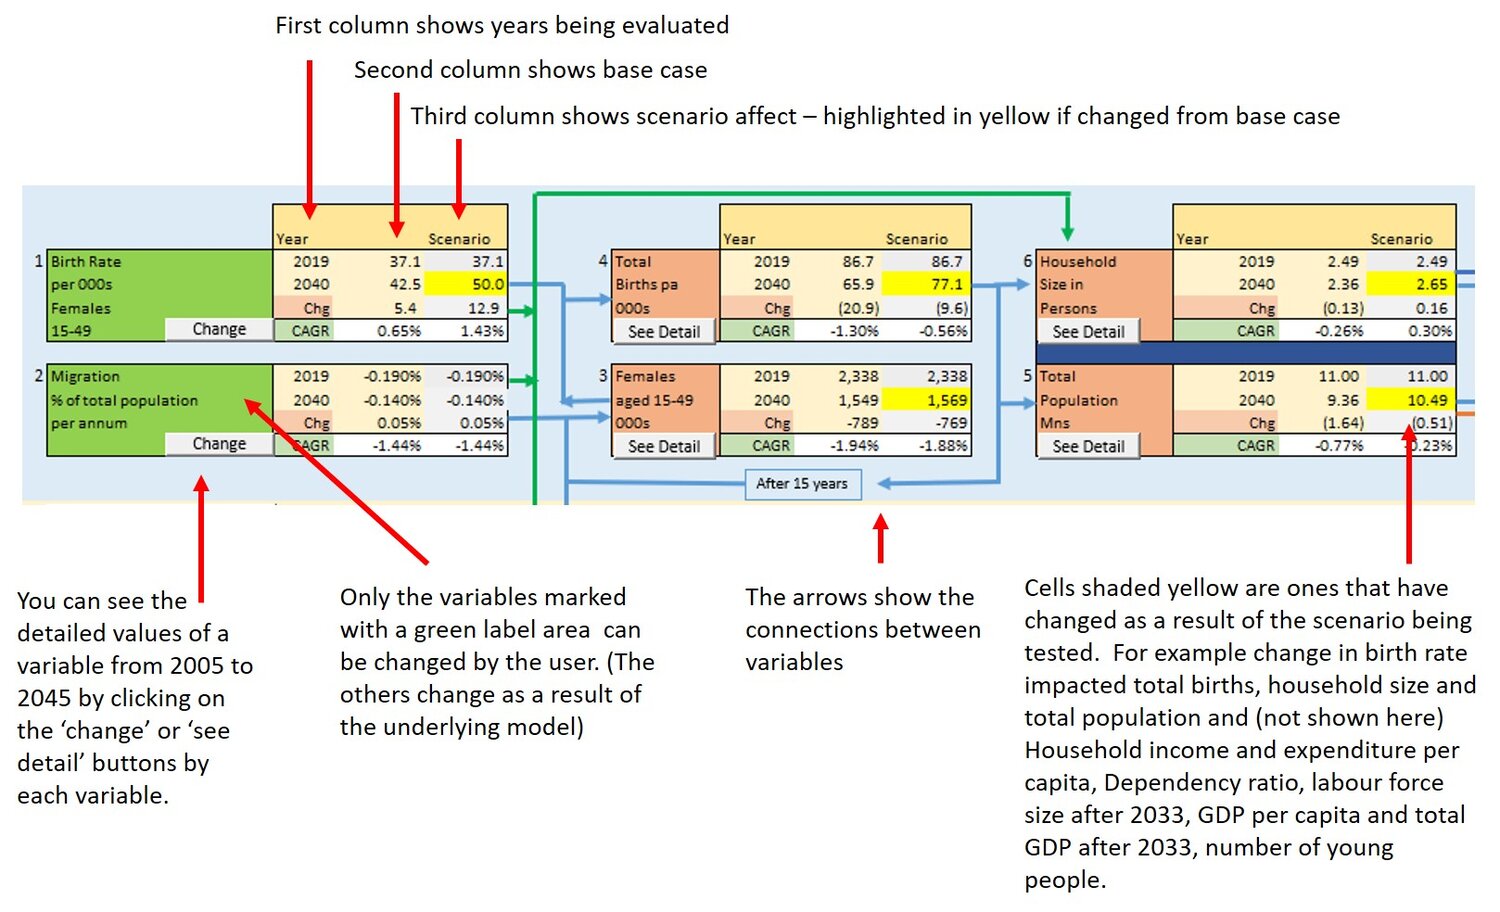
The ‘See Detail’ or ‘Change’ button takes you to the new window as shown below.
This gives the exact value for the selected variable for all years from 2007 to 2043
Select the ‘Return to Model’ button to quickly look at another variable.
PROCEED TO NAVIGATING AROUND THE MODELBy 2045
The total population of China is projected to decline to 1.378 billion persons - down from 1.411 in 2020 (Census). This assumes the average birth rate per thousand women aged 15 to 49 increases from 44 (in 2019) to 50 in 2024 and then declines to 46 by 2045, reflecting trends in improved education and affluence.
Annual births in 2024 are expected to be 15.7 million and are projected to decline to 12.4 million by 2035 and 11.541 million by 2045.
For more information on births in China, see our Special report on this topic
Learn more