


Publications
- 2045
- 2045-china-pages
- Ability To Pay
- About us
- Bespoke Analysis Services
- Cart
- Changing Forecast Values
- chapters
- Checkout
- China Cities in Database
- China Villages/Townships in Database
- China’s Cities Profiles
- China’s Demographic Future
- Cities and Towns in China currently included in the Database
- Contact us
- Countries Covered
- Country Demographic Profiles
- Database Content
- Definitions and relationships
- Demmod – Introduction
- did-you-know
- Epidemiologic Data
- for-example
- Funding Environment
- Home
- How To Subscribe
- Interactive Demographics Purchase
- Interpreting the Results
- Loading data into the model
- Manual For Online Database
- Market Profile Data
- Methodology – China Database
- Methodology- Country Database
- My account
- Navigation around the model
- Online Database
- Online Database Introduction
- Overview
- Overview of the Model
- Publications
- Report: Impact of China’s New Birth Policy
- Report: Impact of Demographics On China’s Future GDP Growth
- Reports
- Running the Scenario
- Selecting Countries To include
- Shop
- Shop Tset
- table contents
- table-of-contents
- Variable Definitions
- Willingness To Pay
- Wtp Scenario Model 1
- Wtp Scenario Model 2
China’s Demographic Future
2018 EDITION
BUY ONLINE TODAY AND GAIN AN INSIGHT INTO WHERE CHINA IS NOW AND WHERE CHINA IS HEADING OVER THE NEXT 20 YEARS.
The ‘no nonsense’ briefing on the future of China.
By understanding how China’s demographic profile will change over the next 20 years the reader will see the opportunities (and challenges) that will emerge in future years.
A synopsis of the Chapters is Given below.
Available exclusively on Amazon.
You can purchase this book for US$35.00 in either soft form (immediate download) for Tablet or Kindle or Paperback form (2-3 day delivery) from Amazon.
To purchase through Amazon please click here
CHAPTER ONE: INTRODUCTION, CONTENT AND METHODOLOGY
This section explains why it is important to understand the nature in which China’s demographic profile will change over the next 20 years. It also explains the content of each of the subsequent 9 Sections so that the reader can understand the range of issues covered by each Section and how the overall picture is developed.
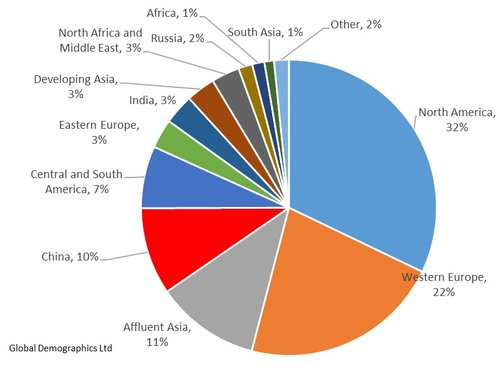
In 2017 China accounts for an estimated 10% of global consumer expenditure. By 2037 it is estimated to reach 13%. In real values this means an increase of 187% in total consumer spending over 20 years or 3.2% per annum.
CHAPTER TWO: THE EXISTING DEMOGRAPHIC PROFILE
The existing size, gender and age profile of the population is the fundamental determinant of many future changes in a society. It therefore has to be the starting point of the forecasts. The second Section of this Report provides the reader a comprehensive description of the existing (and immediate past) profile of the population of China. It provides a briefing of the geographical organization of the population and how the population is reported in China (for example, Hukou versus residency, urban versus rural). It then looks at the existing age and gender profile of the population, separately for urban and rural and the resulting size of the key life stage segments. This is followed by a description of the existing situation in terms of housing including the number of units, physical size and profile in terms of number of people in them.
It then provides a description of the ‘drivers’ behind the labour force. That is the number of working age persons and their propensity to be in work, and the existing number of workers and how that has changed over the last decade. This is done separately for urban and rural populations as the dynamics are quite different. This leads into a description of the factors which influence the productivity of the workforce and how they have changed over the last decade. That is education and Accumulated Fixed Capital Investment per worker.
Finally, there is an examination of household incomes and how they have changed in the last decade.
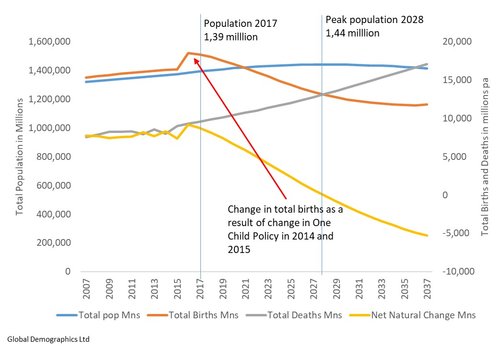
In 2017 China’s total population is estimated at 1.39 Billion persons:
Of These
- 48% are over the age of 40 years
- 59% are living in an urban area
- 54% are employed
- Avg Gross Urban Household income is Rmb 141,134 pa
- 6% of urban households have a gross income over Rmb 317,000 pa (US$50,000)
- 73% have Lower secondary or better education and 16% have a tertiary or vocational qualification.
CHAPTER THREE: THE PROJECTED POPULATION TREND OVER THE NEXT 20 YEARS.
This Section examines the expected trends in birthrates, number of women of childbearing age, death rates by age and gender and, finally, migration and their collective impact on both National Population as well as the population of individual provinces. The most problematic of these is of course birthrates as these can change as a result of government policy, specifically, the potential relaxation of the one child policy, which cannot be forecast. Overlaying this is the decline that will occur in the number of women of child bearing age which more than offsets the relaxation in the one child policy.
This Section also looks at the ‘Gender’ Issue. At present it is not really a problem as the gender bias is not great in the existing adult population. But the key word is ‘existing’. The gender bias in births over the last decade has been growing and the issue is important by 2027 and certain serious by 2037.
This Section then looks at the impact of the above factors together with province to province migration on the Province level populations.
This Chapter then concludes with a discussion of the effects of the changes to the one child policy in 2014 on total births in future years.
Urbanisation has been a significant factor behind population change in China over the last two decades. As a result of having education available in the rural (and urban) areas it enabled a large labour resource to move from low productivity agriculture jobs to higher productivity urban jobs (tertiary and manufacturing). This movement of labour has helped boost China’s productivity as urban employment is typically three times more productive than rural.
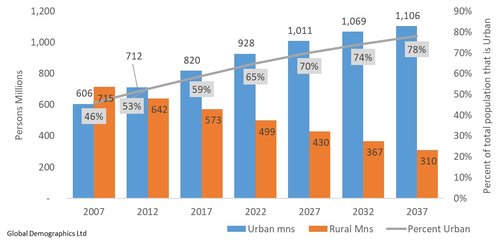
While urbanisation is expected to continue in the future as shown in the chart opposite, the nature of urbanisation is changing as it transits from young people (15 to 39) physically moving to urban locations to counties being reclassified as urban (and no actual movement of people) and which has less of an impact on productivity..
Given trends in the probability of a person by age group moving to an urban areas, and the overall age profile of the rural population, it is projected that:
- Total Urban Population is projected to reach 1,011 million in 2027 and 1,106 million in 2037
- The next decade to 2027 will have 19.1 mn extra urban dwellers per annum
- Whereas in 2017 59% of the population is living in an urban areas, by 2037 it is projected to reach 78%
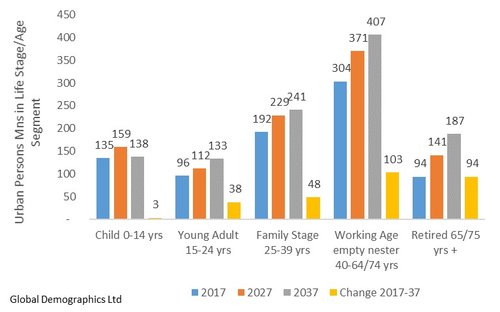
Projected Change in Life Stage/Age Segments in Urban China (2017 to 2037)
CHAPTER FIVE: THE EVOLVING CONSUMER AND HOUSEHOLD PROFILE
This Section explains the changes that are expected to take place in terms of Life Stage/Age Groups in each of urban and rural China and the implications of that for the nature of the households. It details the projected change in number of households, the number of people in them as well as the size of cities they are located in.
The fastest growing life stage segment for the next two decades is the urban ‘Working Age Empty Nester’. It grows in number of persons by 22% in the next decade. These changes in segment size and growth rates have significant implications for the future pattern of consumer demand.
This Chapter also shows how the actual sociological nature of the household can be expected to change – for example, the growth of the ‘childless households’ segment.
CHAPTER SIX: EDUCATION
Education is important as it influences not only the productivity of a worker but it also influences many aspects of society such as reducing the propensity to have more than one child, lifestyle choice, health, and propensity to spend and save. As detailed in this Section, China has achieved very significant improvements in education and clearly it improved millions of peoples’ opportunities and life style. But the projected rate of improvement will now slow as a result of a combination of fewer young people exiting the education system (as a result of the changing age profile of the population) and, frankly, the big improvements have now been achieved with most having lower secondary or better education.
The challenge now is to reduce the differential between provinces. In part this has been a function of education – the more able have migrated to the cities (and provinces) where the better work opportunities are. However, it does mean the capabilities of the labour force of some provinces is not as good as others. This in turn impacts the ability of some Provinces to grow economically.
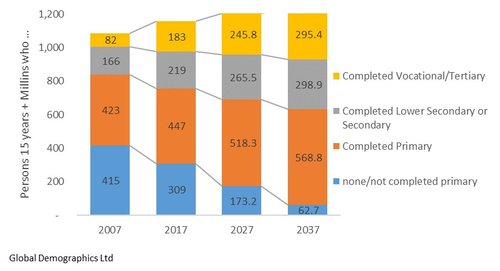
Historic and Projected Trend in Number of Persons 15 yrs + by Level of Education
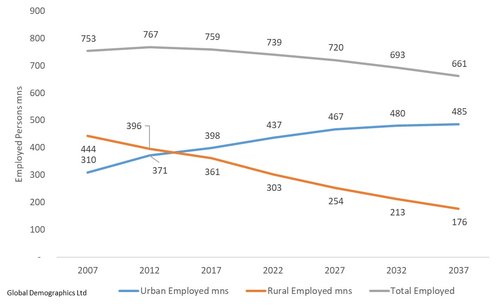
Historic and Projected Size and Trend of Urban and Rural Labour Force.
CHAPTER SEVEN: THE LABOUR FORCE
This Chapter address the issue of how many workers there will be and where they will be located? The labour force is significant because it is effectively the ‘engine’ of the economy. China has been unusual in that relative to most countries it has a very high proportion of its population being of working age and actually in employment. Its working age population is growing slowly to 2025 and then declines, even after allowing for an increasing proportion of 65 to 74 year olds continuing in work. That, combined with a reduced propensity of working age persons to be in employment (for example, as a result of staying in education longer) it is estimated that the total employed labour force will decline from 759 million in 2017 to 661 million in 2037.
However, all of this decline is in terms of the rural labour force. The urban labour force, as a result of rural to urban migration which is biased to persons of working age, is projected to continue to grow over the next decade, albeit at a slower pace, and then stabilise through to 2037. This is important to China’s economic performance. Urban workers are estimated to be about three times more productive than rural.
CHAPTER EIGHT: THE IMPACT OF DEMOGRAPHICS ON GDP FORECASTS
This Section looks at the key drivers behind household income which is of course GDP (and as discussed in the subsequent Section, the proportion of GDP that remains in the private consumption sector).
In terms of total GDP this Section shows what is potentially achievable given the combined impact of improving education profile of the population, and trends in accumulated fixed capital investment per worker, on productivity per worker multiplied by the expected number of workers. The main variable in this chapter is the level of fixed capital investment. Changes in that and Education have a significant statistical relationship with changes in GDP per worker (productivity). Education is stable and while it will experience positive change over the next 20 years it is a steady and predictable improvement. The same cannot be said for fixed capital investment each year, which ultimately determines the level of Accumulated Fixed Capital Investment per worker.
Under a more conservative scenario in terms of annual Fixed Capital Investment, and know improvements in education profile of the worker, productivity per worker is projectd to increase at 4.8% per annum to 2027, which combied with total number of worker declining at -0.52% pa, means Total Real GDP is projected to grow at 4.2% per annum to 2027 and 2.3% per annum for 2027 to 2037.
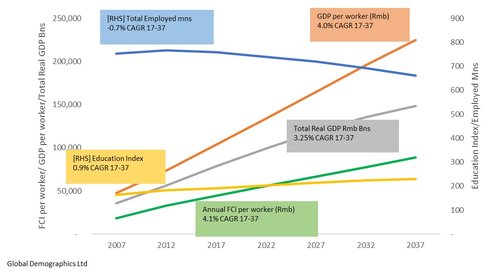
Historic and Projected Trends in the Key Determinants of Total Real GDP
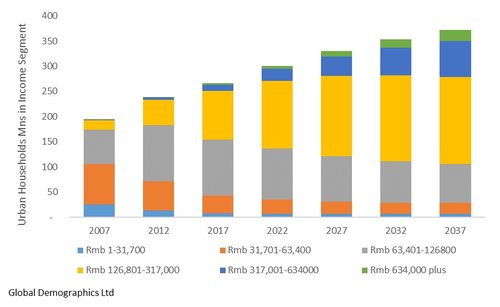
Historic and Projected Trend in the Distribution of Urban Households by Income Segment
CHAPTER TEN: HOUSEHOLD EXPENDITURE PATTERNS
The shifting distribution of households by income clearly has implications for the future pattern of expenditure and that is the focus of this Section. The change is substantial. In 2017 an urban household with an income of Rmb 80,000 will spend 58% of its gross income, and save 36%. This compares with an urban household with a gross income of Rmb 211,000 per annum which spends 52% and saves 37%. Food and non-alcoholic beverages experience the largest change, declining from 16% of gross income at the lowest income segment to 13% for households with an income of Rmb 211,000. This decline in the proportion spent on food and non-alcoholic beverages goes into savings and the proportion spent on the other categories does not change dramatically as income increases.
This Section shows how the urban sector dominates consumer spending. In 2017 it is estimated that urban households account for 76% of all household expenditure. By 2037 it is projected to be 93% with total rural expenditure showing a steady decline after 2017. It is projected that total household expenditure will grow at an average of 4.2% per annum from Rmb 26,586 Bn in 2017 to reach 40,008 Bn in 2027, under a real total GDP growth assumption of 34.2% per annum for the same period.
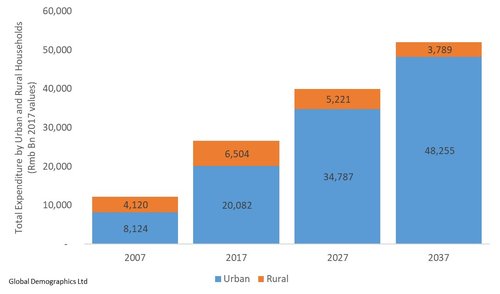
Historic and Projected Trend in Total Expenditure of Urban and Rural Households
CHAPTER ELEVEN: SUMMARY AND STRATEGIC ISSUES
The final chapter has two objectives. First it provides a summary of the major trends outlined in the previous chapters so the reader has an encapsulated view of how China can be expected to change over the next 20 years but with the ability to go back to individual chapters for more specific detail.
Secondly this chapter will try to highlight what the author’s see as the major strategic implications that flow from this analysis of the likely future nature of the demographics of China for people wishing to market their product or services to the Chinese consumer. While obviously the bias will be towards quantitative issues we will nonetheless look at some of the soft issues that potentially impact market size as well as market access.