


Step Two (A)
Changing Forecast Values for Individual
Variables

The forecast values of a Determinant variable is changed by clicking on the button labelled ’change’ in the box for that variable.
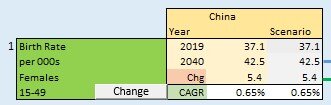
You are reminded that only 12 variables can be changed by the user. The others are a function of the determinant variables. For example total births is a function of the number of women of child bearing age (15 to 49 years) and the birth rate. So to change total births you must change the birth rate. You cannot change the number of relevant women as that is a function of the number of births 15 years ago (plus any migration effect). Therefore the determinant variable is Birth Rate.
The variables that can be changed have a dark Green background in the label section of the box for the variables. They also have a button labelled ‘Change’
Click on that and you are taken to a new window (see below) showing the value of that variable under the base case from 2005 to 2045. The data for years 2005 to 2019 are actual as reported by that country. Values for subsequent years are the current forecast under the Global Demographics Ltd.’s master model.
The base year is constrained to the last year for which actual data exists for that country (currently 2019).
The future year can be any value after 2019 and up to 2045 (inclusive).
Finally, click on the ‘Setup’ Button to load the data. This normally takes only a few seconds, but it is refreshing the underlying data blocks and the screen will switch between different sheets momentarily.. However, you are returned to the main page once finished.

If you have made no changes yet, then the ‘revised’ column (highlighted in yellow) will be empty. (current scenario is also the base case) and the chart will show just one line.
Entering Forecast Values
You then enter values in the yellow column for future years.
You can:
enter a value for every year
or
enter a value for selected years (which can, if you want, just be the last year (2045)) then click on the button ‘fill between points if blank’ and the model will put values in the intervening blank cells assuming a linear trend between those two points.
The resulting data set will then be shown in the chart.
If you are not happy with the forecast simply click the button labelled ‘Clear Input Data range’ and then enter a new set.
Once You are Satisfied with the new forecast values you can either
Press the ‘insert into Model’ button in which case the data is captured into the data set and used for the forecast - but NOTE - the data for that variable has been updated but the new scenario still needs to be run by clicking the ‘run scenario’ button in the main model sheet. The program is done like this as you may want to alter more than one of the determinant variables before running the solution.
RUNNING THE SCENARIOBy 2045
The total population of China is projected to decline to 1.378 billion persons - down from 1.411 in 2020 (Census). This assumes the average birth rate per thousand women aged 15 to 49 increases from 44 (in 2019) to 50 in 2024 and then declines to 46 by 2045, reflecting trends in improved education and affluence.
Annual births in 2024 are expected to be 15.7 million and are projected to decline to 12.4 million by 2035 and 11.541 million by 2045.
For more information on births in China, see our Special report on this topic
Learn more